ISLabMaterial
Lab 9: Working with I2C sensors and MongoDB in Python
Introduction
In this lab, you will learn how to use the I2C bus to communicate with sensors and how to store the data in a MongoDB database. You will also learn how to use the Python library pymongo to interact with the database.
Objectives
By the end of this lab, you will be able to:
- Understand the concept of the I2C bus
- Use the I2C bus to communicate with sensors, reading data from the sensors
- Store sensor data in a MongoDB database
- Use the
pymongolibrary to interact with a MongoDB database
Hardware
In this lab, we will use the Rock Pi 4 SE single-board computer and the AHT-10 humidity and temperature sensor. The sensor will be connected to the I2C bus of the single-board computer. The wiring between the sensor and the single-board computer is already done for you. You will only need to write the Python code to read the sensor data.
Rock Pi 4 SE single-board computer

Rock Pi 4 SE is a single-board computer (SBC) similar to Raspberry Pi. It has a hexa-core ARM processor, 4 GB of RAM, and a 64 GB SD card inserted. It also has a built-in WiFi and Bluetooth module.
A single-board computer is a complete computer built on a single circuit board. It has a microprocessor, memory, and input/output (I/O) interfaces. It is similar to a desktop computer, but it is much smaller and more energy-efficient. It is also much cheaper than a desktop computer. Single-board computers are often used in embedded systems, such as IoT devices.
The board has a number of General Purpose Input/Output (GPIO) pins that can be used to connect sensors and other devices. It also has a number of USB ports, an Ethernet port, an HDMI port, and a 3.5 mm audio jack.
Pinout
Here is the pinout of the Rock Pi 4 SE single-board computer:

| GPIO # | Function2 | Function1 | GPIO Name | Pin# | Pin# | GPIO Name | Function1 | Function2 | GPIO # |
|---|---|---|---|---|---|---|---|---|---|
| 3.3V | 1 | 2 | 5V | ||||||
| 71 | I2C7_SDA | GPIO2_A7 | 3 | 4 | 5V | ||||
| 72 | I2C7_SCL | GPIO2_B0 | 5 | 6 | GND | ||||
| 75 | SPI2_CLK | GPIO2_B3 | 7 | 8 | GPIO4_C4 | DEBUG_TXD | 148 | ||
| GND | 9 | 10 | GPIO4_C3 | DEBUG_RXD | 147 | ||||
| 146 | PWM0 | GPIO4_C2 | 11 | 12 | GPIO4_A3 | I2S1_SCLK | 131 | ||
| 150 | PWM1 | GPIO4_C6 | 13 | 14 | GND | ||||
| 149 | SDPIF_TX | GPIO4_C5 | 15 | 16 | GPIO4_D2 | 154 | |||
| 3.3V | 17 | 18 | GPIO4_D4 | 156 | |||||
| 40 | UART4_TXD | SPI1_TXD | GPIO1_B0 | 19 | 20 | GND | |||
| 15 | UART4_RXD | SPI1_RXD | GPIO1_A7 | 21 | 22 | GPIO4_D5 | 157 | ||
| 41 | SPI1_CLK | GPIO1_B1 | 23 | 24 | GPIO1_B2 | SPI1_CSn | 42 | ||
| GND | 25 | 26 | ADC_IN0 | ||||||
| 64 | I2C2_SDA | GPIO2_A0 | 27 | 28 | GPIO2_A1 | I2C2_CLK | 65 | ||
| 74 | I2C6_SCL | SPI2_TXD | GPIO2_B2 | 29 | 30 | GND | |||
| 73 | I2C6_SDA | SPI2_RXD | GPIO2_B1 | 31 | 32 | GPIO3_C0 | SPDIF_TX | UART3_CTSn | 112 |
| 76 | SPI2_CSn | GPIO2_B4 | 33 | 34 | GND | ||||
| 133 | I2S1_LRCK_TX | GPIO4_A5 | 35 | 36 | GPIO4_A4 | I2S1_LRCK_RX | 132 | ||
| 158 | GPIO4_D6 | 37 | 38 | GPIO4_A6 | I2S1_SDI | 134 | |||
| GND | 39 | 40 | GPIO4_A7 | I2S1_SDO | 135 |
I2C bus
I2C bus is a serial communication bus that is used to connect sensors and other devices to a microcontroller. It is a two-wire bus that uses a clock signal (SCL) and a data signal (SDA). The clock signal is generated by the master device, which is usually a microcontroller. The data signal is bidirectional, which means that it can be used to send data from the master device to the slave device and from the slave device to the master device.

You may notice that we have connected a sensor via I2C7_SDA and I2C7_SCL pins. It’s the AHT-10 humidity and temperature sensor.
AHT-10 humidity and temperature sensor
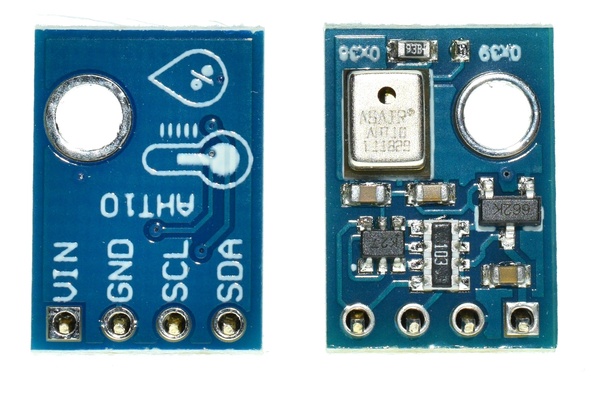
ATH-10 is a humidity and temperature sensor that can be connected to the I2C bus. It has a built-in microcontroller that can be programmed to read the sensor data and send it to the I2C bus. The sensor can be connected to the I2C bus using a Grove connector.
The data sheet for the sensor can be found here: https://www.aosong.com/userfiles/files/media/Data%20Sheet%20AHT20.pdf
Accessing sensors using the I2C bus with Python
Development environment
We will use VSCode to write and run Python code. VSCode is a free and open-source code editor developed by Microsoft. It has built-in support for Python. It also has a number of extensions that can be used to add support for other programming languages and frameworks.
Installing VSCode
To install VSCode, go to https://code.visualstudio.com/ and download the installer for your operating system. Then, run the installer and follow the instructions on the screen.
Installing Python extension
To install the Python extension, open VSCode and click on the “Extensions” icon on the left side of the window. Then, search for “Python” and click on the “Install” button.
Create a new project with a main.py program
Please create a new folder for your project on Desktop and name it with lab11. Then, open VSCode and open the folder you created. Then, create a new file called main.py and add the following code to it:
import datetime

print(f'Hello, now is {datetime.datetime.now()}')
Then, save the file and run it by pressing the “Run” button on the left side of the window. You should see the output similar to the following:
Hello, now is 2021-10-18 15:00:00.000000
The above code imports the datetime module and uses it to print the current date and time. The datetime module is part of the Python standard library and does not need to be installed separately.
The print function is used to print the output to the console. The f prefix before the string indicates that the string is a formatted string. The {datetime.datetime.now()} expression is evaluated and the result is inserted into the string.
In this lab, you will use the main.py program to read the sensor data and store it in the database.
Detecting I2C devices
There are three I2C buses on the Rock Pi 4 SE single-board computer. To find out the I2C bus number, run the following command in the terminal:
/usr/sbin/i2cdetect -l
The output should be similar to the following:
i2c-1   i2c             rk3x-i2c                              I2C adapter
i2c-4   i2c             rk3x-i2c                              I2C adapter
i2c-7   i2c             rk3x-i2c                              I2C adapter
To see what devices connected to I2C bus 7, run the following command in the terminal:
/usr/sbin/i2cdetect -y 7
The output should be similar to the following:
     0  1  2  3  4  5  6  7  8  9  a  b  c  d  e  f
00:                         -- -- -- -- -- -- -- --
10: -- -- -- -- -- -- -- -- -- -- -- -- -- -- -- --
20: -- -- -- -- -- -- -- -- -- -- -- -- -- -- -- --
30: -- -- -- -- -- -- -- -- 38 -- -- -- -- -- -- --
40: -- -- -- -- -- -- -- -- -- -- -- -- -- -- -- --
50: -- -- -- -- -- -- -- -- -- -- -- -- -- -- -- --
60: -- -- -- -- -- -- -- -- -- -- -- -- -- -- -- --
70: -- -- -- -- -- -- -- --
The 38 is actually the I2C address of our AHT-10 sensor. The I2C address is usually written in hexadecimal format, so the I2C address of the sensor is 0x38.
Reading data from the I2C device using Python
In order to read the sensor data, you will need to use the smbus2 library. This library provides a Python interface to the I2C bus. It allows you to read and write data to the I2C bus using Python.
Installing the smbus2 library
To install the smbus2 library, open the terminal in VSCode and run the following command:
pip install smbus2
Using smubs2 to read data from the I2C bus
To read data from the I2C bus, you will need to create an instance of the SMBus class. This class provides methods for reading and writing data to the I2C bus. The constructor of the SMBus class takes one argument, which is the number of the I2C bus. In our case, the number of the I2C bus is 7, so we will create an instance of the SMBus class with the following code:
from smbus2 import SMBus
import time

bus = SMBus(7)

bus.write_i2c_block_data(0x38, 0xAC, [0x33, 0x00])
time.sleep(0.5)
data = bus.read_i2c_block_data(0x38, 0x00, 8)
In the above code, we send 0xAC command with payload [0x33, 0x00] to address 0x38. The 0xAC command with payload [0x33, 0x00] will trigger the sensor to do measurement. Then, we wait for 0.5 seconds and read the data from the sensor. The data is read from address 0x38 with command 0x00 and blcok length equals to 8. We then store result data in the data variable.
Extracting temperature and humidity data from the sensor data
The sensor data is stored in the data variable. The data is stored in the following format:

We could extract the temperature data reading by the following code:
temp = ((data[3] & 0x0F) << 16) | (data[4] << 8) | data[5]
And then we could extract the humidity data reading by the following code:
humi = ((data[1] << 16) | (data[2] << 8) | data[3]) >> 4
The above code uses bitwise operations (Shift, AND and OR) to extract the temperature data from the data variable. The temperature data is stored in the temp variable.
Calculating the temperature value from sensor data
The formula to calculate the temperature from sensor data is as follows:
We could calculate the temperature value in celcius degree by the readings using the following code:
temperature = temp / 1048576 * 200 - 50
Finally, we could print it out using the following code:
print(u'Temperature: {0:.1f}°C'.format(temperature))
The above code uses the print function to print the temperature value in celcius degree to the console. The {0:.1f} is a placeholder for the temperature value. The 0 indicates the index of the value to be printed. The .1f indicates that the value should be printed with one decimal place.
Calculating the humidity value from sensor data
The formula to calculate the humidity from sensor data is as follows:
Exercise: Calculate the humidity value in percentage
Please try to calculate the humidity value in percentage using the above formula and print it out using Python code.
Storing sensors data using MongoDB on Cloud
In this section, we will create a cloud MongoDB on MongoDB Atlas. We will use the cloud MongoDB to store the sensor data.
Introduction
What is MongoDB?
MongoDB is a document-oriented database. It stores data in the form of documents. Each document is a set of key-value pairs. MongoDB is a NoSQL database. It does not use SQL to query the data. Instead, it uses function calls to query the data.
What is MongoDB Atlas?
MongoDB Atlas is a cloud MongoDB service. It provides a MongoDB database as a service. It allows you to create a MongoDB database in the cloud without installing any software on your computer.
Create a Database on MongoDB Atlas
Sign up for a MongoDB Atlas account
To sign up for a MongoDB Atlas account, go to the following URL:
https://www.mongodb.com/cloud/atlas
Then, click on the “Sign up” button to sign up for a MongoDB Atlas account.

After that, ou will need to fill-up a questionnaire for the first time setup. You could fill-up the questionnaire as follows:

After that, you will need to create a MongoDB cluster. A cluster is a group of servers that store your data. Then, select the “M0” option. Then, select the “AWS” option. In the “Region” dropdown list, select “Hong Kong”. Give it a name as your like and click on the “Create” button.

Then, fill in the username and password for your MongoDB database. Then, click on the “Create User” button.

After that, click on the “Network Access” tab and then click on the “Add IP Address” button. Then, click on the “Allow Access from Anywhere” button. Please add a entry for 0.0.0.0/0 as follows:

After that, please click on Go to Dashboard button in the following screen.

Storing the sensor data in the MongoDB database
After we got the temperature and humidity data, we could store it in the MongoDB database. To do so, we will need to install the pymongo library. The pymongo library provides a Python interface to the MongoDB database.
Installing the pymongo library
To install the pymongo library, open the terminal in VSCode and run the following command:
pip install pymongo
Generate a MongoDB URI
In order to connect to your MongoDB database, you will need to generate a MongoDB URI. To do this, follow the instructions in the previous lab.

After logged-in to your MongoDB Atlas account, click on the “Connect” button for your cluster. Then, click on “Connect your application”. Select “Python” as the driver and “3.6 or later” as the version. Then, click on “Copy” to copy the URI to your clipboard. You will need to paste this URI into your Python code later in this lab.

Please replace <password> with the password you created for your database user.
Using pymongo to store data in the MongoDB database
To store data in the MongoDB database, you will need to create an instance of the MongoClient class. This class provides methods for connecting to the MongoDB database. The constructor of the MongoClient class takes one argument, which is the URL of the MongoDB database. In our case, the URL of the MongoDB database is mongodb+srv://db:<password>@cluster0...:27017/, so we will create an instance of the MongoClient class with the following code:
** Remember to replace <password> with the password you created for your database user and use the URL you copied from the MongoDB Atlas website in the following code. **
from pymongo import MongoClient

client = MongoClient('mongodb+srv://db:<password>@cluster0...:27017/')
db = client.database

record = {
    "sensor_id": 1,
    "temp": temperature,
    "humi": humidity,
    "date": datetime.datetime.now(),
}
db.sensors.insert_one(record)
In the above code, we create a record variable to store the sensor data. Then, we insert the record variable into the sensors collection in the database database. The database database is the database we created in the previous lab. The sensors collection is the collection we created for storing sensor data. The insert_one method will insert the record variable into the sensors collection. If the sensors collection does not exist, the insert_one method will create the sensors collection for us.
The insert_one method will also create an _id field for the record variable. It’s a unique identifier for the record variable used to identify the record variable in the sensors collection. The _id field is automatically generated by the insert_one method.
The sensor_id, temp, humi and date fields are the fields we created for storing the sensor data. The sensor_id field is used to identify the sensor. The temp field is used to store the temperature value. The humi field is used to store the humidity value. The date field is used to store the date and time when the sensor data is collected.
Putting everything together in an Infinite Loop
Now, we have learned how to read the temperature and humidity data from the sensor, how to calculate the temperature and humidity value from the sensor data, and how to store the sensor data in the MongoDB database. We could put everything together in a infinite loop to continuously read the temperature and humidity data from the sensor, calculate the temperature and humidity value from the sensor data, and store the sensor data in the MongoDB database.
import datetime
import time
from pymongo import MongoClient
from smbus2 import SMBus

bus = SMBus(7)
client = MongoClient('mongodb+srv://db:<password>@cluster0...:27017/')
db = client.database

while True:

    bus.write_i2c_block_data(0x38, 0xAC, [0x33, 0x00])
    time.sleep(0.5)
    data = bus.read_i2c_block_data(0x38, 0x00, 8)

    temp = ((data[3] & 0x0F) << 16) | (data[4] << 8) | data[5]
    humi = ((data[1] << 16) | (data[2] << 8) | data[3]) >> 4

    temperature = temp / 1048576 * 200 - 50
    print(u'Temperature: {0:.1f}°C'.format(temperature))

    # Exercise code: Read the humidity data from the sensor

    record = {
        "sensor_id": 1,
        "temp": temperature,
        "humi": humidity,
        "date": datetime.datetime.now(),
    }

    db.sensors.insert_one(record)
    time.sleep(60)
The above code will read the temperature and humidity data from the sensor every 60 seconds and store the sensor data in the MongoDB database.
If you would like to stop the program, you may press Ctrl + C in the terminal.
Visualize the sensor data with MongoDB Charts
After we stored the sensor data in the MongoDB database, we could visualize the sensor data with MongoDB Charts. MongoDB Charts is a tool for creating visualizations of data stored in the MongoDB database. It allows us to create charts, graphs, tables, and other visualizations of the sensor data stored in the MongoDB database.
Creating a MongoDB Charts project
To create a MongoDB Charts project,you may go to Database Dashboard and click on the “Charts” button.

Then, click on the “Start” button in the welcome page.

After that, click on the “Select” button in “Chart builder”.

You will need to select your database and collection as data source for the chart. Please select the database database and the sensors collection as data source for the chart.

Inside the editor, you will need to select the chart type. Please select the “Continuous Line” chart type.

To set the axis, you will need to select the “Date” field for the X-axis and the “temp” field for the Y-axis. You can drag and drop the fields from the “Fields” panel to the “X-axis” and “Y-axis” panels.

As we want to see the recent temperature changing on the chart at real-time, we will need to set the “Time Range” to “Previous 1 day” or “Previous 1 hour”. And the time zone should be set to “UTC+8”.

After that, you may click on the “Save and close” button at the top right corner of the editor.

Outside the editor, we can see a refresh button, click on it, select the refresh settings.

We can change the refresh interval to 1 minute. Then, click on the “Save” button.

Exercise: Create a chart for humidity
Please create a chart for humidity using the same steps as above.